Wednesday, October 22, 2008

Casio Classpad 330, Creating a Histogram

Today in class we looked at how to produce a Histogram using the list editor. A Histogram is used when data is continuous (there is no gap between intervals).

Class interval (Frequency)
0 <= x <>=80 (1)

Tap in the list editor. Tap Edit in the menu bar. Tap Clear All. and tap Ok in the dialog box. If a graph is open tap the StatGraph pane to select it. Tap the cross in the top corner of the window to remove the graph.

Name a column in the list editorclassmid’using the soft keyboard. Put the midpoint of each class into the classmid column. eg. {5,15, 25, .., 85} (make sure you name the column before putting the data in!).

Name a column in the list editor ‘freq’ using the soft keyboard. Add each corresponding frequency into the freq column. eg. {3,10,16,..,1}.

Tap SetGraph in the menu bar. Tap Setting. Select Histogram in the Type dropdown, select classmid in the XList dropdown and freq in the Freq dropdown. Make sure the Draw option is on. Tap Set at the base of the dialog box.

Tap the StatGraph icon in the icon bar to display the graph. Make HStart 5 (midpoint of first interval) and HStep 10(size of intervals).

A Histogram will appear. Tap the StatGraph pane and then tap Analysis in the menu bar. Tap Trace in the menu.

A flashing crosshair should appear above the first column of the graph. Use the blue cursor key to navigate column values in the graph. You can use these values to create your histogram on graph paper. The xc at the base of the graph are horizontal axis values and the Fc are your vertical axis values.

viola!


Other educationWA articles on CAS calculators
How to navigate through menus (what's a menu bar?) Click here
How to create a list (what's a list editor??) Click here

Here's a link to an index of other CAS calculator posts.

Monday, October 20, 2008

Casio Classpad, day 1 with students

As I play with the calculator things become a little more obvious. It was good fun with my year 10's showing them how to find the mean of

S:{10,12,13,14,15}

with the CAS calculator during p5 on a 35°C day and then set Maths for WA3 10C with 50 items in the sample. I was upfront in saying to my students that learning all the new content next year and learning how to use the calculator was a bad idea (lights went on... ahh, that's why I need to get one this year!!). For those students still unsure, I made them find the mean of a 50 item sample with their scientific calculators. They promised to buy a CAS calculator tomorrow.

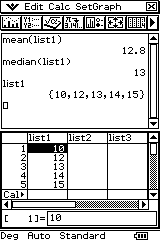
Anyhow.. this is one way of finding the mean with the CAS calculator. There are many better ways but the idea was to learn how the calculator works (the picture is the end result).

Open a main application in the work pane.
  1. The last icon in the tool bar should be a graph. Click the dropdown to the right of the graph. Tap the icon that looks like three columns in the sub menu. The list editor will open in the bottom pane below the main application.
  2. We need to give our list a name. Tap the top of the first column. “list =” should appear at the base of the list editor.
  3. Press the blue Keyboard button. The list editor will temporarily move to the top pane. The soft keyboard will appear in the bottom work pane.
  4. There are four tabs in the soft keyboard. Tap the abc tab with the stylus. A qwerty keyboard should appear. Name the first column in the list editor ‘list1’ if it is not already. You may need to click again in the list editor list= textbox first.
  5. Press blue Keyboard to get rid of the soft keyboard. The main application should reappear in the top pane and the list editor in the bottom pane
  6. Use the stylus, tap the first cell in list1.
  7. Using the number keys press 10 then exe (bottom right hand corner of the keypad). This should put the first number in the list. Not that the cursor has dropped to the next item in the list without having to use the stylus. Now enter 12 then exe. Your list should now have two entries. Add the remaining entries.
  8. Click in the main application. Raise the soft keyboard with the blue Keyboard button. Open the abc tab and type list1 and press exe. {10,12,13,14,15} should appear.
  9. Click Action in the menu bar and tap List-Calculation. Tap mean from the options provided. 'mean(' should appear in the main application.
  10. Complete the action by typing ‘list1’ using the soft keyboard and the button ‘)’. You should now have ‘mean(list1)’ displayed. Press exe. The answer 64/5 will appear. To get a decimal representation, highlight ‘64/5’ with the stylus and click the first icon in the icon bar.
viola. You should be able to finish the tutorial by finding the median yourself. (An alternate way is to type list1, highlight it, tap the Interactive item in the menu bar, tap list calculation in the sub menu and then median and then select ok at the base of the dialog box.) You could also use statistics mode (tap Main on the icon bar, then tap Statistics.) The Statistics application is very similar in structure to the stats mode on the fx graphics calculator).

Here's a link to my last article on learning how to use a CAS calculator.
Here's a link to an index of other CAS calculator posts.
Sunday, October 19, 2008

My Casio Classpad 330 Journey

Second weekend playing with the calculator.

When I was doing phone support often I could not see what the person on the other end was doing. I became quite adept at directing customers on quite difficult tasks blind. The most important thing to do was to adequately define things up front.

With the CAS calculator the windowing system can be quite confusing at first. It is important to name things in such a way that students can listen to your direction and follow it, rather than needing snapshots all of the time.


In the worksheets I have created, the calculator is divided into the screen and the buttons. The screen in divided into the menu bar, the tool bar, the work pane, the status bar and the icon panel. The buttons are blue, grey and black.

i.e.
The Edit, Action, Interactive text at the top is the menu bar
The icons underneath the menu bar is the tool bar
The area underneath is the work pane, it can be split into the top pane and the bottom pane. The work pane is currently filled with the main application.
The bit beneath the work pane (eg. Alg, Standard, Real, Deg, battery indicator) is the status bar.
The stylus and buttons are used to enter data and operations into the calculator.

Here's a link to the "How do I.. ???? on a Casio Classpad" book that I have been using.
Here's a link back to my first article on CAS calculators
Here's a link to an index of other CAS calculator posts.

Friday, October 17, 2008

Management in schools

Having a management background sometimes makes me have to look twice at those that are in management positions, particularly those that criticise superiors. In my day that was called whiteanting.. a popular (and healthy) pass time of staff, a particularly unhealthy occupation of management. Management that did stupid things like that found themselves being shown the front door.

For similar reasons management that wished to leave were given their severance and shown the door rather than working out their notice. Unhappy management talking about how the "grass is greener" elsewhere rarely have the motivation to do their job to the level required. It tends to be half hearted and based around explaining why leaving is a good idea to other staff. There are exceptions based on circumstance but usually this is true.

A strong administration gives an organisation direction and purpose. In teaching (where promotion is often from within to administration), a strong relationship often exists with staff and the newly promoted that cross the staff/admin boundary; this inexperience ends with the newly appointed siding with staff rather than with school policy set by the senior management group. Pre-policy positions should be open to discussion with staff but dissension with policy (once decided) should stay with the SMG.

This is why in many cases it would be better to gather administrative staff from out of school, rather than promote from within (temporary postings are the exception to this, this is where you get experience for a permanent position). The staff relationships are less fixed and a clear line can be drawn that is needed for a working environment. Good time guys with unprofessional relationships with staff allow schools to be run down as staff run in individual directions and lose direction on teaching outputs. Old boys networks within schools should be discouraged at all costs. Management is about setting the school direction and managing staff - when management and staff are travelling in different directions then this is not a positive outcome.