Saturday, January 31, 2009

Maths backgrounds for worksheets and Powerpoint

As an upper school teacher, we sometimes ignore the requirements of appearance of our materials and focus on presenting quality content. This is evident in the material available on the web.

When I get a moment I like to (in the words of my wife) make things pretty and spend the time to ensure there is a background on worksheets, a powerpoint slide with a coloured background and the like.

One site I like to use is http://www.brainybetty.com/. There are some great free backgrounds there for Powerpoint. I really like the orange one and have used it a lot.

Here is a background I made for a recent certificate for the summer school using the MSWord 2003 equation editor.

Have no fear the image is bigger. Just click on it, right click the image and save it. Here's a simple way to make it a watermark in Word 2003.

  1. Open up a Word document.
  2. Go Format->Background->Printed Watermark
  3. Select the Picture Watermark option
  4. Click Select Picture
  5. Find where the background is saved and select it
  6. Change the scale to 200% (or to whatever works for your image unless you want a tiled image)
  7. Ensure the washout checkbox is selected
  8. Click apply

Voila. A professional background for your MSWord 2003 document.

Sometimes you will find the washout selection too light for your printer. In that case you need to insert the picture, send it to behind the text and increase the brightness of the picture to a printable level that doesn't interfere with the readability of the text. This is the way I usually do it as my printer is temperamental but it makes it a bit of a cow to work with the page.

Here's how it turned out.

Friday, January 30, 2009

Getting fired up about the start of term.

Yes, another PD session today . The time left for planning was great and I am feeling ready to start the new term. The work done at the end of last term has made this easier than expected thus far. Our TIC provided input on the course and directed worthwhile changes. Programmes and daily plans are written for the three year 10 streams my yr 11 1B/C classes, 3A/B MAT, 3A/B MAS and yr 12 Modelling with Mathematics. Yay!

We're all pretty keen to get started and even the most cynical of us are looking forward to what the year can bring without last year's threats of industrial action. Let's get on with the job of teaching.

The PD material was of dubious standard with a part time presenter condensing a week long course into 1.5 hrs to a group of 60 teachers from different learning areas. The topic of course was literacy, which meant another rehash of primary strategies, collaborative learning and.. you guessed it.. graphical organisers.

We were asked 'how we knew that students were engaged?' with a range of answers from 'if a student is looking at you (culturally inappropriate in many cases)' to 'actively answering questions (disposition/culturally inappropriate)'. No answer was given by the presenter (I think her answer was discredited before she had a chance to supply it). Doodling notes on the page was deemed a valid method of note taking. We again were informed that the 2 squillion genre's were a necessary part of learning and teaching.. a focus on breadth of learning over depth again. The change in emphasis from version 1 to version 2 of First Steps is a shame as the original First steps had focus and is still a valuable teaching tool as it gave students a foundation to learn other genres. Despite being a Maths teacher I own copies of both the first and second editions of First Steps.

The presenter put us in a lineup and instructed us to stand from engaged to not engaged. She then asked us 'Did we feel engaged by PD opportunities? and to position ourselves accordingly in the lineup. I stayed where I was which was on the disengaged side. As I had been critical of earlier answers (and was sitting under the presenters nose) she asked me why I felt disengaged from PD sessions. I said that I rarely encountered worthwhile PD (to which I embarassingly received a clap from staff). Yep.. that's me.. survival skills of a bunny on a freeway.

More seriously I would add to that PD's are rarely well prepared as they inadequately take into account prior learning (no more bloody graphical organisers!), show little awareness of the requirements of staff (we had staff from every learning area), have no follow up or action points (this may be more of a management issue), take too long to tell too little and generally are just not good value for money. She rightly guessed I was a maths teacher as I was critically evaluating the value of PD sessions.

On just the value for money point.. 1.5hrs x 60 people at an average of $70,000 per year conservatively cost the school $3,000 in lost wages. That's a projector installed for each of the teachers in Maths which would benefit 150 students every year or a new set of text books for a classroom. It has an opportunity cost of our students having a more cohesive programme that could have been developed. I would be interested to know how many graphic organisers are actually used in classes or how many teachers use the text supplied.

I don't accept that we should be grateful for any PD given and accept mediocre presentations. If we waste 90 man hours of training time, it is a criminal waste. We cannot stay professionals and not continue to learn our craft. Without good PD opportunities we cannot grow at our optimum rate.

I took away one point from the PD, an interesting example on the use of questions to promote discussion on a subject. It was ok but explicit teaching would have imparted the same knowledge (drink water if in the desert) in 1 minute rather than through a round of discussion. I can see how it could be useful and is another tool to use in the kit bag. It also explains why a number of my alternate lessons work..

The materials presented by the principal were great in that they allowed teachers a chance to vent concerns in a healthy environment. In another session it was interesting to hear that 360° reviews were contemplated and rejected (where teachers review performance of management and vice-versa). It's difficult to see the benefit of inexperienced management staff reviewing inexperienced staff. It's all a bit silly really when experienced staff exist to perform the teaching review within the school.

It was raised that we needed to communicate better with like schools and embrace some of their successful strategies. This is a great idea - unfortunately one rarely possible. It would be good to see long term strategies that lead to teachers on loan to adjacent schools for terms, semesters or for the year, further developing our abilities and bringing back learning to our schools.

It was nice to hear that many teachers thought our mathematics summer school was a worthwhile first attempt. It will be interesting to hear the anonymized results when they are handed to admin by students on the first day back. These trailblazing year 11 3A MAS and MAT students are the bleeding edge of our new maths students and for them to succeed would be great for them and the school.

Only time will tell.

Tuesday, January 27, 2009

Understanding reports in WA

I am often asked to interpret reports of friends children and explain to parents what the report really means. I am no expert on writing primary reports but I am critical of the lack of transparency in school documents and the degree of technical literacy required to understand them.

Reports are one of those things that have been bastardised by bureaucracy and politics. To be honest their usefulness is limited in their current form unless you are a teacher or bureaucrat. Even as a teacher, the variance of grading between one teacher and the next is too great making the data unreliable and thus is rarely referred to. Here are two cases that recently presented themselves.

Scenario A
Student is in year 7, has been given an excellent report. He has a level three in Maths and English and is finding school boring and too easy.

Q: Is my student doing ok?
A: Probably not. If they are level 3 and finding school easy then they are not being extended enough. Asked student to record what they did today in paragraph form (not dot points). Spelling accuracy was limited. Student was writing without an understanding of conjunctions, limited punctuation and was writing very slowly. Student could not recall last book longer than 10 pages read. Student could not recite 4 or six times tables. Student had limited understanding of order of operations.
Remedy: Indicated that parent needed to take greater interest in performance of student. Suggested student complete homework at kitchen table each night with parent assisting and providing additional examples to complete. Indicated a few books that the student may like and indicated that parents reading with them would be a good idea. Suggested methodology for learning tables and order of operations.

Level 3 is the minimum level a student should be getting in year 7. You would expect students to be completing a variety of level 4 tasks in year 7. Sadly many teachers are only teaching level 3 material. This is very evident when talking to primary teachers at PD through their lack of understanding of level 4 tasks in mathematics.

Scenario B
Student is in year 4. He is the top of their class in mathematics and performed well in NAPLAN testing. He has been given a B. The student is distressed as they expected an A.

Q:Huh? How can this be?
A:Back in the day when we were students, results for a class were scaled to a normal distribution - each class had a few A's, a few more B's, lots of C's, a few D's and a student or two earmarked for being held back. Sadly this is no longer the case. If a teacher does not teach the 'A' material (for whatever reason defined by that abomination smartie chart), an A will not be given, the same goes for B's, C's, D's & E's. In this case this is what has happened. NAPLAN testing at this level is more IQ testing than progress testing which is why this result was consistent with student and parent expectations.
Remedy: I supplied printed copies of progress maps and pointers for mathematics and links to sample items for the next NAPLAN test. Suggested parents consider looking at level of student and work at assisting student understand material at the next level.

It may sound ok to define 'A' material and provide an 'A' consistent with students across the state until you consider that in some low socioeconomic schools if grading was done consistently with curriculum framework directives, no student would get higher than a C for the first years of schools whilst they caught up to their contemporaries in more affluent schools. Even gifted students (but lacking environmental support) get discouraged as they try to overcome their lack of support at home and get C's despite making large jumps in knowledge and applying themselves. Although the idea of A-E grading was good, the application was poor. For low ability students in lower classes - they may never get higher than a D despite a great work ethic and working at a level consistent with their peers.


The solution? Provide normalised results for each class on reports (allowing students to get grades in relation to their peers) and use NAPLAN tests to show progress in relation to other schools with expected ranges for university and TAFE entry. Duh!

(Addendum 30/1/2008: It is interesting to note that the West had an informative article on just this topic today.. details of the article can be found here (half way down the page) by Bethany Hiatt titled "Parents need lessons on the grading system". Yes I am being positive about a media article - must be the optimism and endorphin spike associated with the start of a new year.)

Thursday, January 22, 2009

Trigonometry and CAS calculator I

During exams last year we noticed that those who had CAS calculators were not using them for Trigonometry problems. During summer school we sought to rectify this. To start with we looked at properties of triangles.

Students stated that the calculator would give no solution when solutions existed. This sounded doubtful but I had a good idea where they were going wrong.

I started with the following. Take three lines, 4cm, 2cm, 1cm. Now obviously this can't make a triangle. Right?


No matter how we change the angles at A & B they cannot form a triangle. This was to inform students that a no solution result in their calculator had meaning.

So now we had a look at a problem that they were having difficulty with.

In their work pads they had written A=x, a=5cm, B=72°, b=72 and labelled the triangle correctly. So far so good.

They could tell it was a sine rule problem but had difficulty entering it into the calculator. Where did the sin, cos, tan buttons go from the calculator?

The first thing to do is find the sine function. Open the soft keyboard, select the mth tab and press the Trig button at the bottom of the keyboard.


Next enter the sine equation with the substituted values. They needed the fraction template inside the soft keyboard under 2D


Hitting execute at this point gives no solution. Huh?

Well.. we still have to solve for x. So highlight the equation and go to the interactive menu (in the menu bar at the top of the work pane), select Advanced and then solve. The Equation should be there and the variable listed should be x.


After a rather long wait a huge expression appeared with a strange looking answer.

I'll rekey it here as the whole answer does not appear on the work pane on the calculator.

{x=360.00.constn(1)+137.209, x=360.00.constn(2)+42.791}

The answers are the two bits in red (at this point we had a bit of a chat about the ambiguous case with the sine rule). To get to the answer you have to navigate with the style and the left/right arrows at the edges of the equation.


So the answer is x=137° or x=43° (0 d.p.)

We then drew these triangles to give students a better understanding of the ambiguous case.

In the next example we'll look at the perils of rounding and go back to the case above with the impossible triangle.


Here is a link to other CAS calculator posts.

Tuesday, January 20, 2009

Solving Simultaneous Equations using the Classpad 330

There are a number of ways of finding where two lines intersect. Let's solve this example.

"Where do the equations y=x and y=-2x+3 intersect?"
One way to find the solution is to solve the two equations algebraically using simultaneous equations.

First open and clear the main work pane.


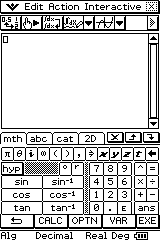
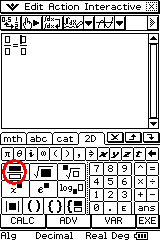
Press the blue Keyboard button and bring up the soft keyboard. Select the 2D tab.

You should be able to see a button with a bracket and two small boxes (circled below in red). Press it.


You should see the simultaneous equation template in the main pane.
(Update 1/6/2010: Press it twice to add a third equation line!)


Click on the first box and type y=x
Click on the box below it and type y=-2x+3

In the third box to the right of the vertical line type x,y (the variables we wish to solve).


Hit the exe button.

The answer (x=1, y=1) should appear.

Here is a link to other CAS calculator posts.

Thursday, January 8, 2009

Classpad 330 and Normal Distribution

Normal distribution problems can be done quite simply on the Classpad 330, but the method seems a little weird.. perhaps I haven't found a menu yet, or completed an update.. but here's how I did it for the following problem.
"A packet of mince contains 500g of mince. Suppose the actual weight (x) of
these packets is normally distributed with a mean of 512 grams and a standard
deviation of 8 grams. What is the probability of picking a packet between 504
and 520g?"
Firstly open the main window and add the list editor from the toolbar.

Opening the list editor should make the Calc menu appear in the menubar at the top of the window.

Select Calc->Distribution. This will make a popup appear with some options


The Type dropdown needs to say Distribution.

The second dropdown should say Normal CD. After that is selected tap Next. A new dialog box will appear.

For our problem the lower bound is 504, the upper bound is 520, the standard deviation is 8 and the mean is 512. Tap Next when this has been entered. The answer will appear with a probability of 0.683


Tap the graph icon in the toolbar to view the distribution.


Viola!
Here is a link to other CAS calculator posts.